Recently work has seen me fiddling with JSON APIs and Python’s requests module. I was also intrigued by the talk of decarbonisation and the banning of gas-fired heating systems.
The received wisdom when I studied this stuff was that it was better to burn fossil fuels in your home directly, than have a power station burn them for you and use the resulting electricity for heating, but maybe the increasing amount of wind energy on the grid has changed things?
While researching this I came across this fine effort by National Grid, Oxford University, WWF, and Environmental Defense Fund Europe. They are using machine learning to forecast the carbon intensity of electricity for the UK’s regions up to 48 hours in advance. Interestingly, in spite of the UK having a “national grid”, the carbon intensity can be very different for different regions, as power seems to mostly be consumed in the same region it’s generated. It turns out that living near to one of Europe’s largest wind farms and 2 funky vintage nuclear power stations, the electricity supply to Conner Labs is mostly wind and nuclear and can have a very low carbon footprint indeed.
Since Carbon Intensity didn’t offer a handy regional forecast widget, and JSON APIs are almost fun, the obvious course of action was to grab a Raspberry Pi and make something to inform my electricity consumption decisions.
https://github.com/ConnerLabs/carbonhat The source code is here for your edification and entertainment (?)
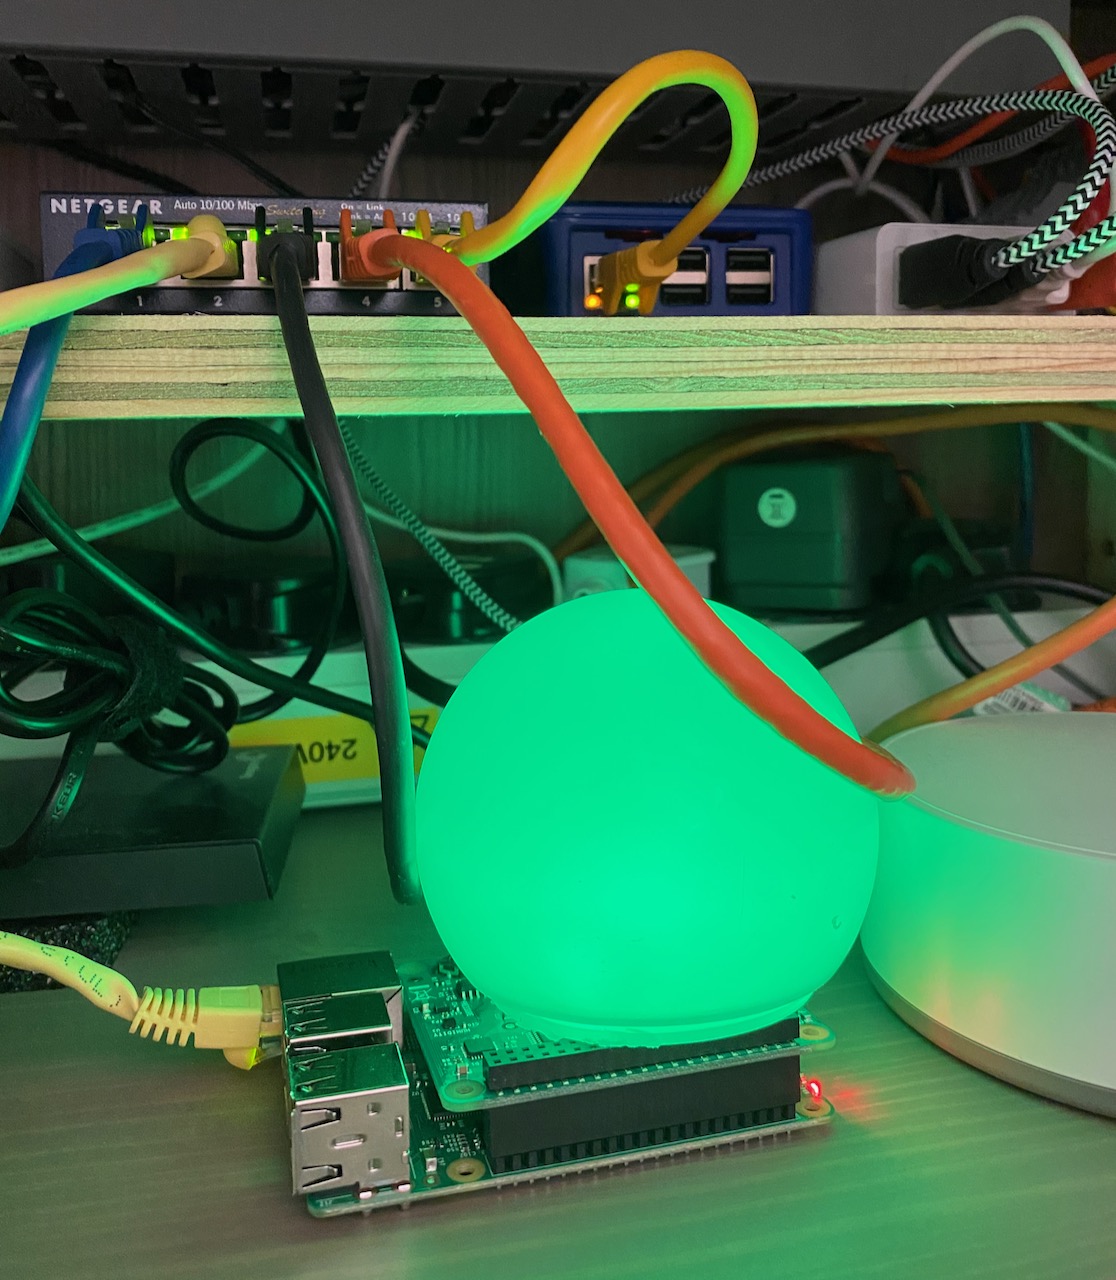
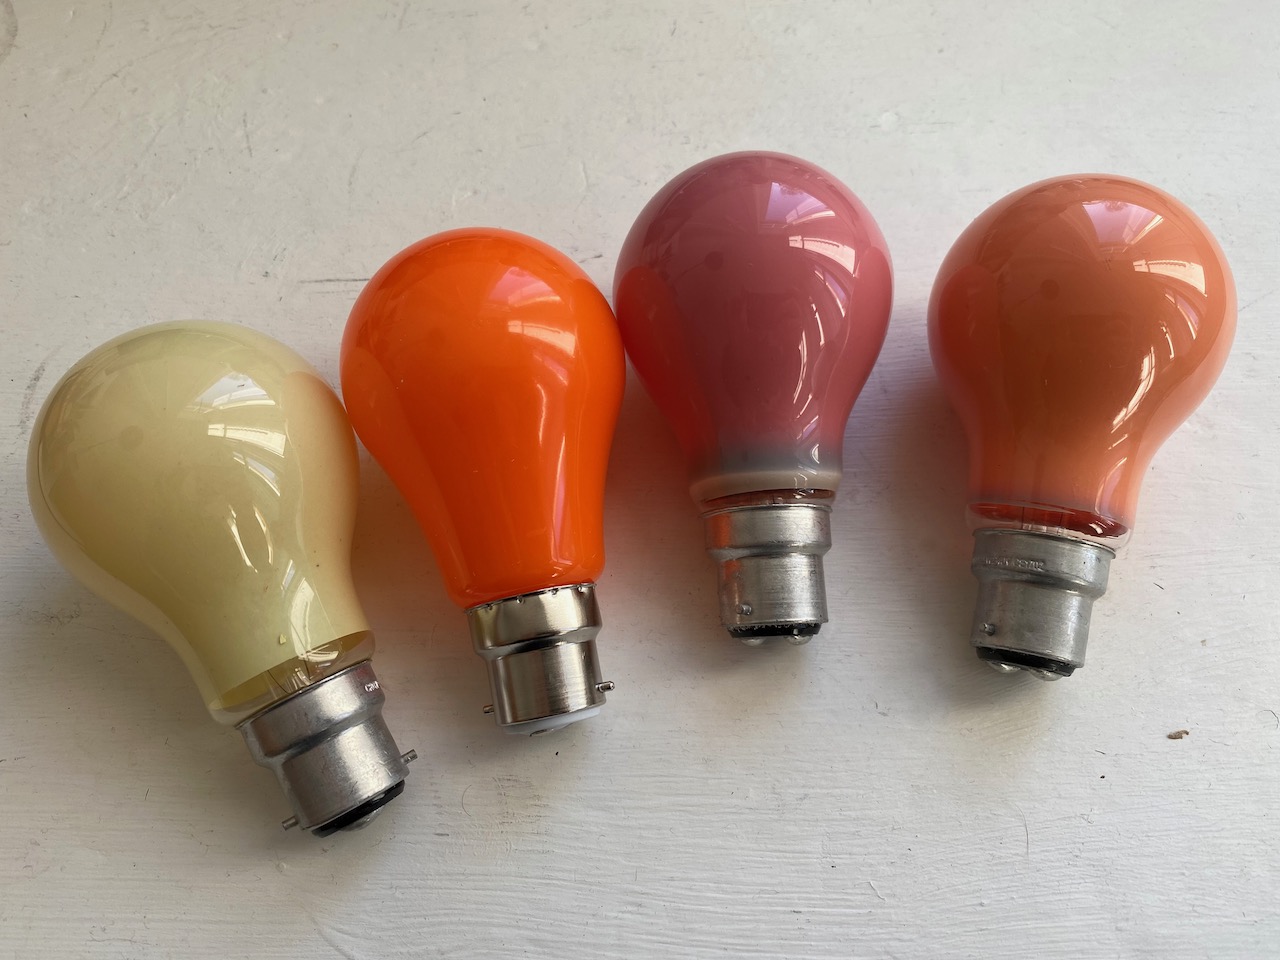
I found a Sense HAT in my drawer of IoT junk (some might say it’s more like an entire building than a drawer) so I used the RGB LED matrix on that to display the result. It fades from green at an intensity of 0, through to red at 215g CO2/kWh, which is approximately the carbon footprint of natural gas burnt for heating. All LEDs are programmed to the same colour, and it is covered with a globe from a broken LED light bulb to make it look like a single light source.
Carbon Intensity’s forecasts are updated every half hour, so I pull the 24 hour regional forecast from their API a few minutes after each half hour, and crunch it down to a single number representing the average carbon intensity for the next 3 hours.